News
|October 8, 2024
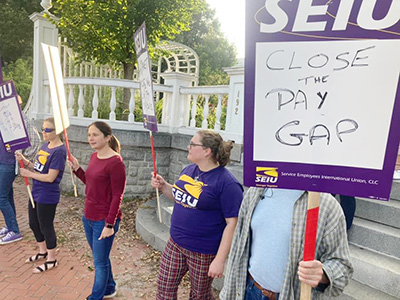
The State of Maine has still made no real progress in closing the pay gap
MAINE SERVICE EMPLOYEES ASSOCIATION, SEIU LOCAL 1989
RESPONSE TO THE STATE OF MAINE’S MARKET PAY REPORT
To: Committee on Appropriations and Financial Affairs; Committee on State and Local Government
From: MSEA-SEIU Local 1989
Date: October 8, 2024
On Monday, September 30, 2024, the Commissioner of Finance and Administration released its Market Pay Report (“State Report”) detailing its review of salaries of employees of the State of Maine’s Executive Branch (“State”) in relation to the broader labor market.
The primary takeaway is that, while the Mills Administration has done better than prior administrations, the State has still made no real progress in closing the pay gap that exists between State workers and employees in the broader labor market.
Specifically, the State Report shows that the average State worker is now earning 86% of the market rate, up from 85% in 2020.[1]
Maine State government is plagued by vacancies, with devastating effects on the public that relies on services. The State is unable to fill vital positions to ensure that State ferries can run, that youths in state custody at Long Creek Youth Development Center are adequately served, that phone calls to Maine DHHS eligibility specialists are answered without two-hour hold times, and that the thousands of children served by the Office of Child and Family Services receive the services they need.
In many instances, understaffing poses a significant risk to State employees. For example, 64 of 204 MSEA-represented permanent and limited period full-time positions—or 31%–at Riverview are vacant.[2] As a result, staff is regularly forced into unsafe encounters with patients. This has frequently led to violent assaults on staff—often with life changing consequences, including severe traumatic brain injuries.
Accordingly, persistently below-market wages and the resulting staffing issues have devastating effects both on the public and on State workers, and it is imperative that the State make meaningful progress on closing the pay gap.
Unfortunately, as will be discussed below, the State’s Market Pay Report is likely a best-case scenario. For example, the State Report reflects that the gap between State employees and the private sector has actually grown since 2019. Specifically, as detailed in the report, between 2019 and 2023, private sector compensation grew by 26.3%, but compensation in State government grew by only 21.6%.[3] However, despite citing these figures in the introductory section, the State did not factor these numbers into its final calculation of the overall pay gap.
This, combined with other analytical flaws (discussed below), suggests that the actual pay gap is likely larger than 14%.
Among the numerous issues with methodology and data in the State Report are the following:
- The State Report vastly overrepresents classifications that have already received market pay adjustments, which skews the overall findings toward the market average.
- The State failed to obtain data from a sufficient number of competitor employers.
- As a result, only a handful of the classifications reviewed meet the express sufficiency requirements for statistical significance.
- The State Report is overly reliant on the published survey sources, resulting in fictitious public sector positions and speculative salary data.
MSEA will address each of these issues below.[4] MSEA will also offer its input on the path forward and the steps necessary to meaningfully address the pay gap.
- The State Report overrepresents classifications that have already received market pay adjustments, which skews the overall average.
The State Report reviews 74 benchmark classifications—slightly less than the 82 reviewed in the Segal Report in 2020.[5] However, the State’s criteria for selecting benchmark classifications did not ensure that it was capturing a balanced representation of workers.
Specifically, while Segal selected benchmark classifications based on the number of positions within and adjacent to the particular classification, the State selected their benchmark classifications based on two factors.
First, they selected the most populated positions in each administrative unit. Second, they selected positions based on the highest stipend amount in each administrative unit.[6] Pay stipends are adjustments made to positions via either a statutory recruitment and retention process, legislative mandate, or collective bargaining, and they are meant to address understaffing by bringing salaries closer to the market average.
The vast majority of classifications in State government do not have pay stipends. However, due to the State’s preference for reviewing positions with stipends, a majority included in the State Report—39 of the 74 classifications—already have market pay stipends attached. 5 of these classifications each contain a single position,[7] and an additional 19 classifications have 10 employees or less.
As a result, one-third of the benchmark classifications—covering only 103 positions—already have a market pay adjustment increasing their salary by approximately 10 to 30%.
This vast overrepresentation of classifications with large market pay adjustments already applied automatically skews the overall average closer to the market average. A more balanced approach that does not overrepresent positions with stipends would likely reflect a much larger pay gap.
- The State failed to obtain data from a sufficient number of competitor employers.
In 2009, the State commissioned a market pay report from the Crescendo Consulting Group (“Crescendo Report”). The Crescendo Report utilized data obtained directly from more than 250 private and public sector employers. Classifications with at least 8 total matches from these peer employers were included in the Crescendo Report.
The 2020 Segal Report relied on data obtained directly from 12 public sector employers, and then utilized three separate published survey sources as a proxy for the broader private sector market, for a total of fifteen unique sources of information. Classifications with at least 5 total matches from the peer employers or published survey sources were included in the Segal Report.
Here, the State adopted the same sufficiency requirement as Segal—specifically, it sought five matches for each benchmark classification.[8] However, the State obtained data from four public sector employers and two published survey sources—meaning they had only six potential sources of information from which to find at least five matches.
- As a result, only a handful of the classifications reviewed meet the express sufficiency requirement for statistical significance.
Unfortunately, in most cases, the State did not have a sufficient number of matches from the public sector comparators.
- 8 positions had 0 matches among the peer employers
- 17 positions have 1 direct match
- 41 positions had 2 direct matches
- 8 positions had 3 direct matches
- No position had 4 direct matches
Thus, only 8 classifications—those with the three direct matches plus the two public survey sources—had a sufficient number of matches for inclusion in the State Report.
- The State Report is overly reliant on the published survey sources, resulting in fictitious public sector positions and speculative salary data.
Faced with a lack of relevant data directly from peer employers, the State generated purportedly employer-specific data from the published survey sources and ascribed it to specific public sector employers, including five cities, six states, and the Federal government, as well as the general “private sector” market in various states.
While the published survey sources are useful for generating general data for the broad labor market—which is how Segal utilized this type of data—the State’s attempt to use this data as proxy for specific peer employers generated flawed results.
a. The published survey data for purported “public sector” workers does not include data from any of the relevant state governments.
During discussions about the data prior to the release of the State Report, the State informed MSEA that the two published survey sources, CompAnalyst and ERI, collect data on a voluntary basis from employers, and that neither company had received data from the relevant state governments—meaning that the purported “public sector” survey data for Maine, Idaho, Massachusetts, New Hampshire, Rhode Island, and Vermont does not actually include the salaries of workers employed by those states. Rather, the State informed MSEA, it believes that the data is pulled from other public respondents, such as the Federal government, counties, and municipalities—although it couldn’t confirm which public sector employers had responded.[9]
This is significant because, in many instances, the work performed by State workers is of a much different breadth and scope than municipal or county workers. For example, State Eligibility Specialists are charged with working with a whole host of State and Federal programs, including MaineCare, Temporary Assistance for Needy Families, Supplemental Nutrition Assistance Program, Child Support, Higher Opportunity for Pathways to Employment, Social Security Disability, and General Assistance. County and municipal employees would only be handling General Assistance. Accordingly, a municipal “Family Services Advisor”—as they are listed in the State’s data set[10]—would not be a valid match for a State Eligibility Specialist.
b. Similarly, in many instances, the purported private sector matches are not true corollaries.
Just as many State classifications have no true corollary at the municipal or county level, many public sector jobs have no true match in the private sector. For example, the State used the published data sources to generate purported private sector “corrections officers” in Maine, Massachusetts, New Hampshire, and Rhode Island. However, none of those states operate private sector prisons – and therefore should not have private sector “corrections officers.”[11]
Similarly, there are no real private sector equivalents for an Emergency Communications Specialist—the State’s 911 operators. There may be private sector Emergency Dispatch Operators[12] that dispatch security guards, ambulances, or tow-trucks—but they would not be coordinating law enforcement responses while walking the caller through a crisis situation or instructing them how to perform CPR or other life-saving procedures.
c. The State Report relies on fictitious positions and speculative salary data generated from the published survey sources.
Upon closer review the State’s data, it is apparent that their use of the published survey sources to populate positions at specific employers generated fictitious positions and speculative salary data.
To use one specific example, the State Report includes salary data for a “Chemist III” employed by the City of Lewiston (“Lewiston”).[13] However, not only is there no “Chemist III” employed by Lewiston, there is no classification that is even a rough approximation of a Chemist III.[14] Given that Lewiston does not employ a Chemist III, the purported salary data ascribed thereto is entirely speculative.
Going further, among the 73 purported classifications identified by the State with actual positions in Lewiston,[15] there are only 22 actual titles that are roughly approximate to the purported matches. The remaining 51 positions identified as matches are non-existent.
The salary data ascribed to the various public sector positions is also suspect on its face. For example, the State Report indicates that Portland and South Portland have the exact same pay range for the cities’ respective “Chemist III” classifications.[16] Given that Portland and South Portland are distinct employers with separate bargaining units, classification structures, and pay scales, it would be a wild coincidence if the salaries for their respective “Chemist III” classifications matched exactly to the dollar—indeed, if the Chemist III classifications even exist at all. Looking more broadly at the entirety of the State’s data, however, one can see that the published surveys indicate that Portland and South Portland have identical salaries for 58 of the 74 classifications reviewed.
This is beyond belief. Taken as a whole, it is apparent that public sector employer-specific data generated from the published survey sources is not based in reality. Rather, these are fictitious positions and speculative salary ranges. It seems to be projections of what a particular classification’s salary range would look like in a particular labor market, rather than precise data drawn from the actual employers referenced.
- The State Report makes various other questionable assertions.
Throughout the Report, the State posits various conclusions and assertions that simply do not hold up under scrutiny. While none of these assertions change the State Report’s primary finding that State workers remain significantly underpaid compared to our peer competitors, it is still worth addressing a couple of them.
First, in describing the non-salary benefits enjoyed by Maine State employees, the State asserts that the Commonwealth of Massachusetts and the States of Rhode Island and Vermont do not offer paid parental leave. This is not accurate. Specifically, by statute, Massachusetts allows 26 weeks of paid family and medical leave per year.[17] Similarly, Rhode Island allows four weeks of paid parental leave under its “Temporary Caregiver Insurance” program,[18] and Vermont offers up to six weeks of paid parental leave through its Voluntary Paid Family and Medical Leave plan.[19]
Second, the State Report touts the Bureau of Human Resources’ role in implementing over 3,000 reclassifications since 2019, which, it writes, ensures that “State employees are paid at the classification matched to their work efforts.” However, this is a misleading argument.
- Of the roughly 3,000 Functional Job Analysis forms that have been processed since 2019, only 1,600 of those were approved reclassifications or range changes.
- The remaining 1,500 were for newly created positions, were denied, or were withdrawn or otherwise cancelled.
- Of the 1,600 approved reclassification or range changes, approximately 600 were lateral reclassifications, “updates” or modifications to the existing title, or position downgrades.
- The vast majority of the remaining FJAs were either reclassifications of vacant positions or Transportation Workers who have completed the training needed to “hurdle” to the next position in the Transportation Worker Series.
Accordingly, the number of workers who have benefitted from reclassifications is a mere fraction of the figure cited in the State Report.
Moreover, to the extent that the State suggests that the reclassification process ensures that workers are being appropriately paid, given the existence of the 14% pay gap identified in the State Report and the fact that the State has not completed a Classification Study in decades, it is fair to say that State employees are not being paid commensurate with either their work efforts or their market value.
- Next Steps
As discussed above, the State Report identifies a pay gap of approximately 14%, a slight improvement over the 15% pay gap identified in the 2020 Segal Report. However, given the data issues identified above and the widening gap between public and private sector employees, the actual pay gap is likely wider.
Also, as is clear from the State Report, the pay gap is not felt equally by all employees. Rather, the data reflects that while certain classifications earn as little as 61% of the market average, salaries for other classifications appear to be above the market average. Accordingly, “one-size-fits-all” across-the-board pay increases will not satisfactorily address the issue. Rather, it will be necessary to target particular classifications that are below market.
The State and MSEA are scheduled to meet in mid-October to begin bargaining implementation of the State Report, and the State has already committed to using funding available through the salary plan during this calendar year, so we are hopeful that some progress can be made.
Unfortunately, however, while the State Report is useful for identifying the pay gap overall, as well as the impact on particular broad groups of employees, the State Report does not contain sufficient data to truly address the issue.
Pursuant to a prior Settlement Agreement with MSEA, the State has agreed to retain a third-party consultant to complete a comprehensive Classification Study by the end of 2025. If the Legislature and the State are serious about tackling this issue, then it is necessary to further fund and mandate an independent and professional market pay study to dovetail with the third-party Classification Study.
[1] See State Report, at page 5. Notably, the State Report also defines the gap based on the lower edge of market competitiveness, or 95% of the market average, and claims that the gap is at 9% rather than 14%. This is a transparent effort to move the goalposts—the pay gap should be based on the market average.
[2] This vacancy data is from on information provided by the State to MSEA in April 2024, pursuant to an information request.
[3] See State Report, at pages 16-17. As State Economist Amanda Rector previously explained to MSEA, this definition of “State employee” includes all three branches of government, as well as the UMaine System and the Maine Community College System.
[4] Since last Spring, the State and MSEA met regularly to discuss the parameters of the State’s review. MSEA has previously raised each of these issues with the State during these meetings.
[5] Notably, the State has previously argued that the Segal Report was not based on enough benchmark classifications.
[6] See State Report at 18. In contrast, the Segal Report did not consider whether a position had a stipend when selecting benchmark classifications.
[7] Building Maintenance Superintendent, Computer Operations Assistant Manager, IT Business Analyst, Occupational Therapist, Systems Group Manager.
[8] See State Report at page 21 (“To meet data sufficiency requirements, selected benchmark classifications were required to meet a threshold of five (5) matches across all selected comparators…”)
[9] Further, after MSEA noted that preliminary data included reference to public sector ferry employees in Lewiston, the State reached out to ERI, who told them that their municipal data was not reliable. Accordingly, the State removed ERI’s municipal data from the final Report. However, as will be discussed below, the State Report still treats a number of fictitious positions, with corresponding fictitious salaries, as matches.
[10] See Comprehensive Market Data by Bargaining Unit 2024 at page 41.
[11] See https://www.sentencingproject.org/reports/private-prisons-in-the-united-states/ (detailing private prison population by state).
[12] See Comprehensive Market Data by Bargaining Unit 2024, at page 43.
[13] See Comprehensive Market Data by Bargaining Unit 2024 at page 92.
[14] The various collective bargaining agreements covering Lewiston’s workforce include position titles, and none include any title related to a Chemist III. See https://www.lewistonmaine.gov/182/Labor-Agreements. Similarly, while the report also suggests the existence of the “Chemist III” classification in Augusta, Bangor, Portland, and South Portland, MSEA can find no evidence that any of these cities employs anyone in a roughly equivalent classification.
[15] The State Report indicates that there was “no match” for one of the 74 classifications.
[16] Id. at page 92 (showing the pay range for a “Chemist III” in both Portland and South Portland to be $71,968.00 to $113,672.00).
[17] https://www.mass.gov/info-details/paid-family-and-medical-leave-pfml-overview-and-benefits
[18] http://ripaidleave.net/wp-content/uploads/2016/09/Fast-Facts-for-Workers-about-RI-TCI.pdf
[19] https://www.metlife.com/insurance/disability-insurance/paid-family-medical-leave/states/vermont/